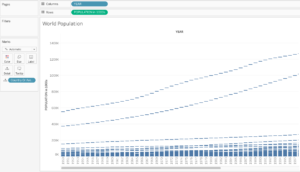
See below for visualization from Tableau:
Chris Cali Portfolio
Welcome to my personal portfolio website. Here, you can see content from my courses in the Data Analysis and Visualization Program.
Monthly Archives: October 2021
Data Structures – Lab 5
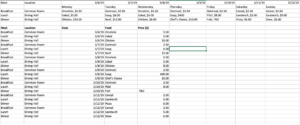
For first portion of this lab, we manually cleaned the data. CSV file linked here. Screenshot below from my manual cleaning work:
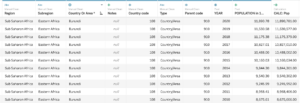
Second portion of Population Data screenshots below:
An Exploratory Analysis of 311 Calls Handled by the DSNY During the COVID-19 Pandemic
Research Question
For this first project, I put myself into the shoes of a DSNY (Department of Sanitation NY) data analyst. I would like to examine the 311 calls that DSNY handles and see if there are any specific types of complaints that need to be addressed, more so than others. In an initial filtering of the data, I think a good way to get the data simplified is to look at it in three ways: citizen issues, sanitation issues, and other issues that do not fit within either of the categories. To further clarify, citizen issues deals with problems that are caused by the average New Yorker – of illegal dumping, residents not cleaning up their garbage properly, etc. Sanitation issues refer to problems caused by the department itself – of complaints about workers, baskets not being picked up, etc. I wonder: As we continue into this new normal, which specific complaints can the DSNY focus on to decrease the amount of sanitation-related 311 calls the city receives and, more consequently, improve the quality of life of New Yorkers and performance of the agency? Additionally, how has the volume of DSNY-related 311 service requests changed throughout the pandemic?
Each of the complaint types were coded the following way:
Citizen Issues |
Sanitation Issues |
Other |
| Abandoned Bike | Collection Truck Noise |
Litter Basket / Request
|
| Derelict Bicycle | DSNY Spillage |
Other Enforcement
|
| Derelict Vehicle | Employee Behavior |
Sanitation Condition
|
| Dirty Conditions | Missed Collection | Snow |
| Graffiti | Missed Collection (All Materials) |
Vacant Lot
|
|
Recycling Enforcement
|
Overflowing Litter Baskets | |
| Snow Removal | ||
| Sweeping/Inadequate | ||
| Sweeping/Missed |
The 311 Service Requests were sorted through and pulled from NYC Open Data. Since analysis is for the time period of the pandemic, data was pulled from March 11, 2020 (my first day of working from home) through August of 2021.
Target Audience
City officials, specifically in the DSNY, but also beyond at City Hall, would be interested in seeing the answer to the research questions above. Having this information would be beneficial to these stakeholders because it can influence where departmental resources are distributed for more efficient use of the DSNY workforce. Additionally, this information can determine if there is any legislation that can be passed to improve conditions for New Yorkers.
Initial Analysis & Visualization
Issue Types
To begin I created a stacked bar chart to demonstrate which types of issues are reported most frequently and further, to show which complaint types are most common in each. I chose to do a stacked bar chart because it allows us to see both of these measures in one chart.
In reviewing the stacked bar chart above, we can observe the following:
- While both DSNY-related issue types are common (with over 70,000 reports each) for both Citizen & Sanitation Issues, 311 callers more frequently complain about issues caused by other average New Yorkers, not the sanitation department itself.
- Within Sanitation Issues, Missed Collection is by far the most frequent complaint type with almost 70,000 reports.
- Within Citizen Issues, Dirty Conditions and Derelict Vehicles are most frequently reported, both at over 50,000 reports.
Design choices for stacked bar chart:
I tried to keep this chart simple, as to communicate clearly. I coded each of the issue types with different colors and then made a gradient for each of the complaint types. We primarily look at the quantities here, so I made sure the tooltip only contained the important information – the complaint type and quantity.
Monthly Trends During the Pandemic
Below, we see how DSNY-related 311 service request volume has changed throughout the pandemic. It is important to note that for all graphs below, we used the date that the report was created, which would correspond to the day that the call was initially made.
I also broke these out into the different issue-type categories to see if there was anything to glean from those differences.
We can observe the following:
- The lowest volume of 311 complaint calls happened in the earlier months of the pandemic. This seems to loosely line up with NYC lockdown in early 2020 and gradual reopening over time. Vaccines started becoming available to select adults in January, but ramped up in March and April. Perhaps there is a slight correlation between the vaccine rollout and 311 calls as well.
- The months with higher 311 service requests appear to be consistent across issue types. We cannot observe that any specific month had significant differences based on issue type on a month-to-month basis.
- March of 2021 has the highest call volume.
Analysis of Missed Collection, Dirty Conditions, and Derelict Vehicles
I am most interested in doing further analysis on the Missed Collection, Dirty Conditions, and Derelict Vehicle complaint types as those are the most common 311 reports to the DSNY. Further analysis of these complaint types can provide information to resolve the most frequent complaints from both issue categories.
We can observe from the line graph above:
- Consistent with earlier graphs, March of 2021 saw the most requests in the three complaint types I am focusing on: Missed Collection, Dirty Conditions, & Derelict Vehicles.
- Missed Collection had a stronger spike – perhaps this is weather related and can be resolved by ensuring more sanitation staff are available to work overtime to address issues of snow and garbage collection.
- Opportunity for further analysis: Does snow have anything to do with this and perhaps the higher winter call volumes in general? We can look at the relationship between weather patterns for those months and the ticket volume. Additionally, we can compare this to calls that are snow-related.
Design Choices for Line Graphs: I decided to make the line graphs very simple and thought that it was more beneficial to split the categories and complaint types into different graphs to make it more easy to view.
Call Completion/Resolution
I had initially tried to do these charts as a bar graph or pie chart. Both were quite ineffective and unnecessary, so I decided to go with a table. We can observe that in all of these categories, most of the tickets are closed.
Opportunities for further analysis:
- Since we used the date that the service requests were created, in other words that the call was made, it would be interesting to see the time elapsed to when they were closed/resolved. This can further illuminate where department resources should be focused.
- Reviewing the descriptors to see what types of responses each of the issues received. One example of a Derelict Vehicle I noticed was that it was not actually a Derelict Vehicle – no further action was required after that.
- Mapping where open/pending cases are.
Conclusion
There are many interesting things to be gleaned from looking at the DSNY 311 Data. It is fair to conclude that both Citizen and Sanitation issues are of big concern and that the Missed Collection, Dirty Conditions, and Derelict Vehicle complaint types are the most common. It would be fair to suggest that DSNY officials take a closer look at these specific complaint types to try and decrease the amount of calls they get in those categories.
Interestingly, it appears that the Winter months of 2021 got the highest volume of 311 complaint calls with another spike happening in the warmer months of 2020.
With this, there are definitely more questions and further analysis to be done.
Downloading 311 Data – Lab 4
Please see my Blogpost 1 titled AN EXPLORATORY ANALYSIS OF 311 CALLS HANDLED BY THE DSNY DURING THE COVID-19 PANDEMIC where I completed these steps.